North America’s solar market kept growing in 2026, even though conditions got harder. Policy changes, trade restrictions and grid connection delays weighed on developers and asset owners. Even so, solar and battery storage made up 70% of all new US generating capacity added in the first half of the year. Who owns those operating assets is changing just as quickly. Our data analysis ranks the 50 largest owners of operational solar in the United States and Canada in 2027. It counts only assets in which companies keep an ownership interest, not development pipelines or projects that were built and sold.
Key takeaways
- The 50 largest operational solar portfolio owners in North America now hold 134.5 GW combined. That is about 20% more than in the previous edition.
- Capacity is concentrating at the top. The ten largest owners account for almost half of the Top 50 total.
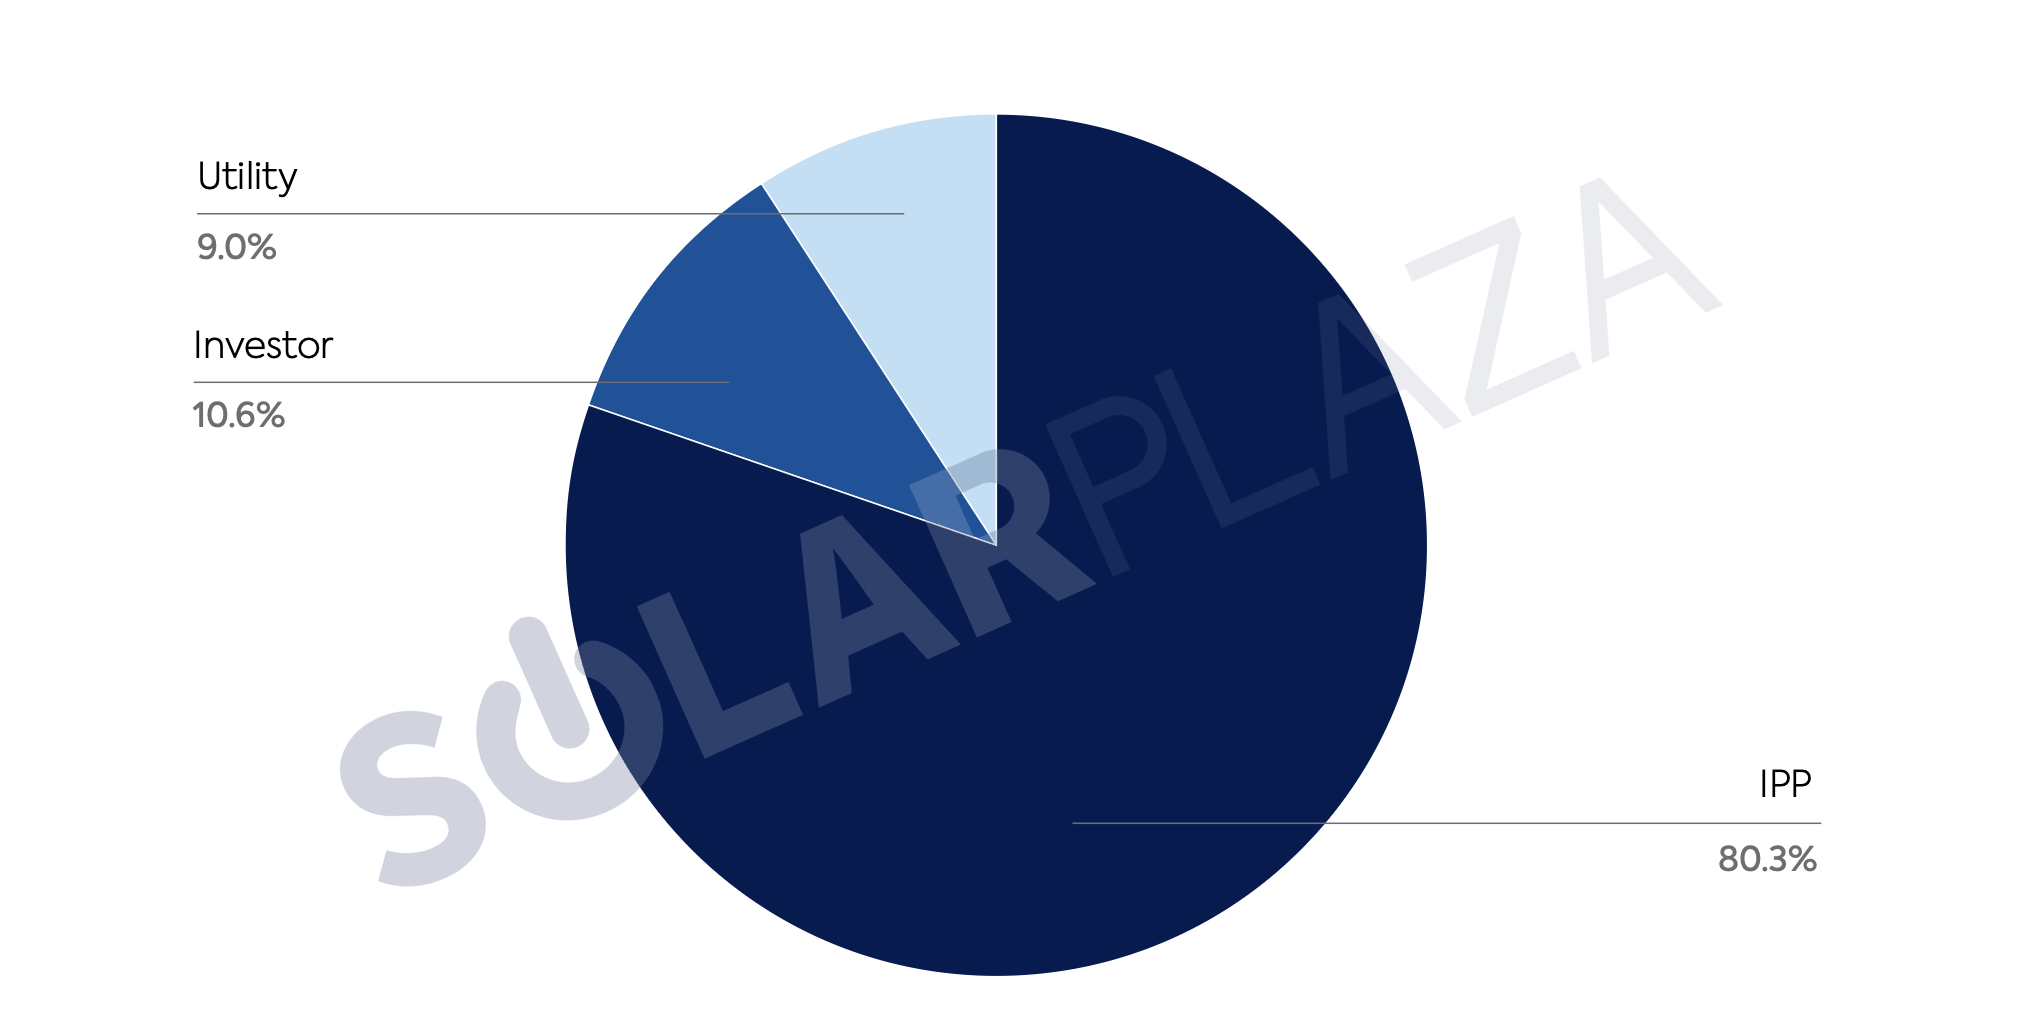
- Independent power producers (IPPs) own more than 80% of the ranked capacity, up from about 75%.
- For the first time, Florida has overtaken California as the leading US headquarters state by portfolio capacity.
- Battery storage is growing fast among major solar owners. Three of them each added more than 1 GW of storage in a year.

A market shaped by IPPs
Ownership types are shifting as well. IPPs have strengthened their hold on the market, and the share held by institutional investors has fallen, though the overview explains why that figure needs careful reading. The chart below shows how the top 50’s operational solar capacity is split between IPPs, investors, and utilities.
Portfolio types based on capacity
The overview also looks beyond the headline numbers. It tracks how fast major solar owners are building out battery energy storage systems (BESS), and it maps where portfolio owners are headquartered across the US and Europe. It also reviews the deals that reshaped the market in 2025 and 2026, from divestments and mergers to infrastructure funds buying entire platforms.
Who leads the ranking
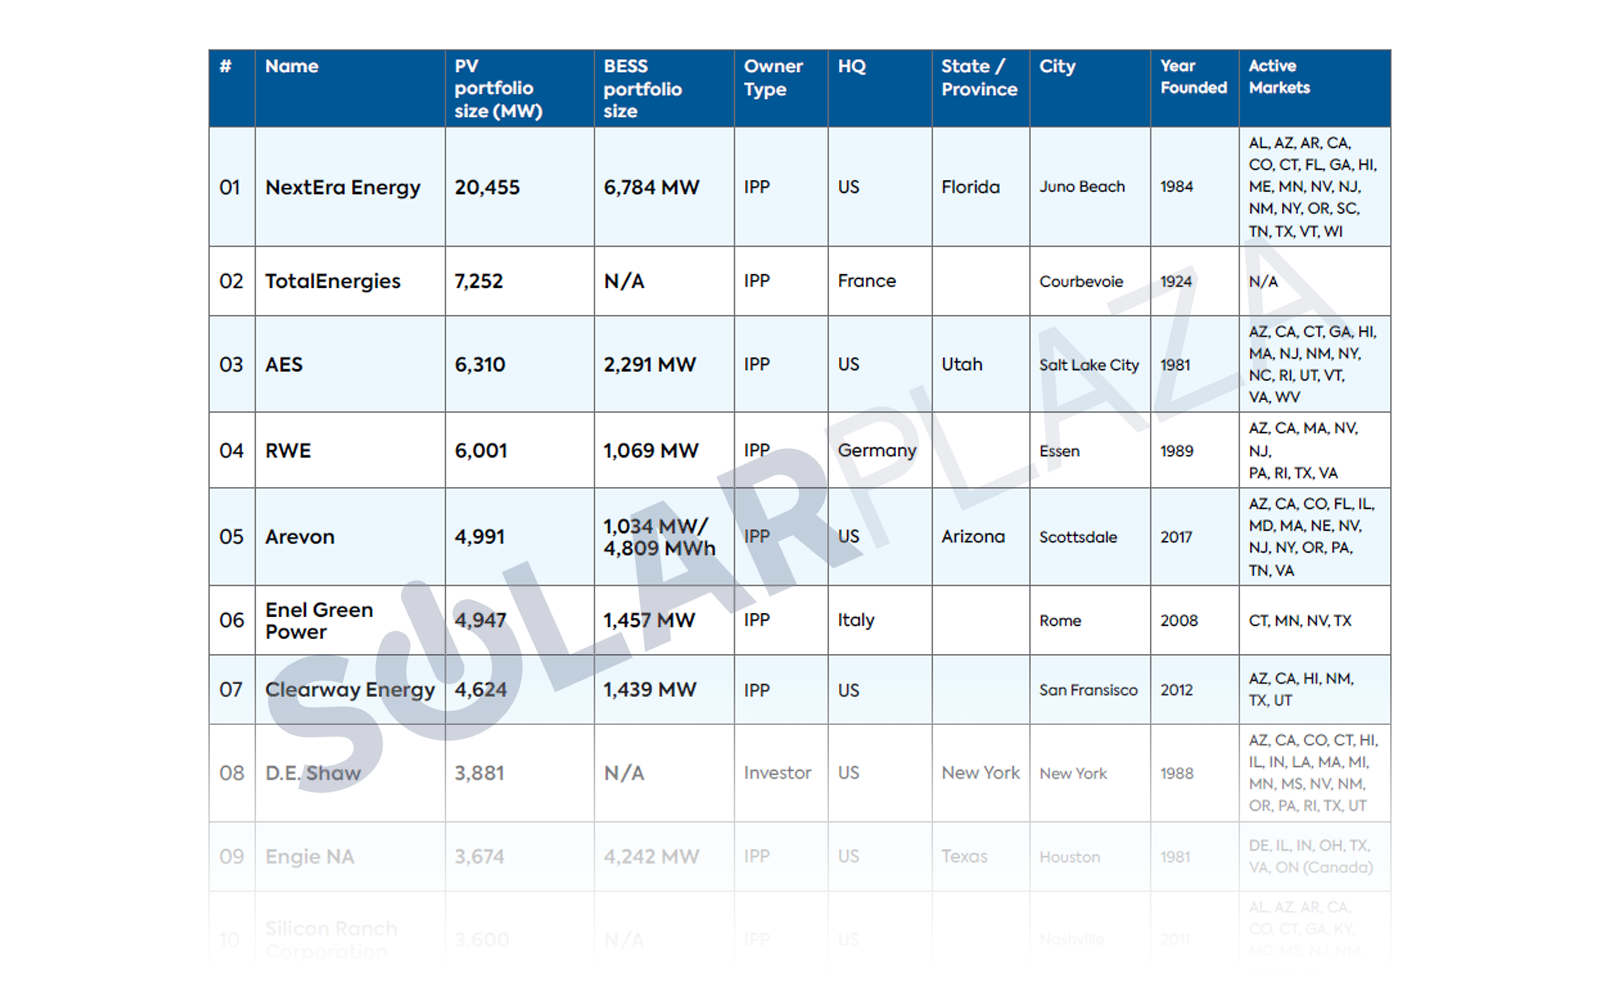
NextEra Energy keeps the top spot by a wide margin. Its operational solar portfolio grew from 11.6 GW to 20.5 GW, which is 15% of the entire Top 50 and nearly three times the size of the next-largest portfolio. TotalEnergies (7.3 GW) and AES (6.3 GW) follow in second and third place. RWE made one of the biggest moves in the ranking, climbing from tenth to fourth as its portfolio grew from 3.8 GW to 6 GW. Arevon completes the top five with 5 GW.
Overview of the top 50 portfolios
Below them, the competition is just as interesting. Two companies broke into the top 10 this year, one of them climbing 15 places and the other entering the ranking for the first time. The list below shows the Top 50 operational solar portfolio owners in North America, starting from the top.
Download the full overview
As portfolios get larger and more complex, the focus is moving from adding megawatts to getting the most out of them. Battery integration, predictive maintenance, repowering, and smarter revenue strategies are becoming essential in volatile, congested markets. These topics will be at the center of the Solarplaza Summit Asset Management North America on 6-7 April 2027 in San Diego.
Download the overview for the complete top 50 ranking, the storage figures, and the full analysis. The overview was produced with the support of Quantified Energy.