Masterclass Energy Storage Benelux: summary article
Introduction
A battery business case that looked solid on 2022 market data can struggle to repay its debt in 2026. Jan Willem Zwang of Stratergy, who has spent twenty-five years in the energy market, says he is currently helping owners of three large batteries whose revenues fell short of the back-tested proposals they signed.
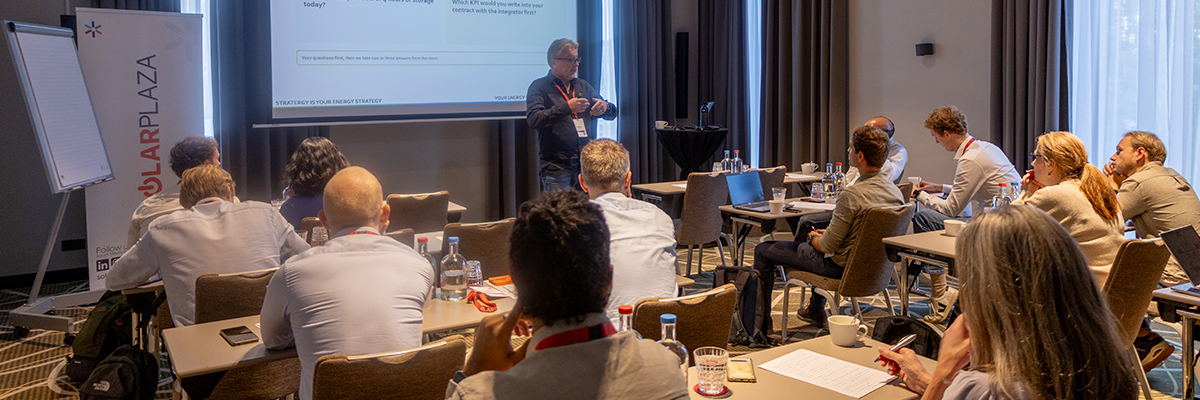
That reality check set the tone for the Solarplaza Masterclass Energy Storage Benelux, which we hosted at the Leonardo Royal Hotel Amsterdam on 8 October 2026. Over one afternoon, Jan Willem took a small group of Benelux energy professionals through four blocks: electricity market fundamentals, the storage asset, revenue stacking, and permitting and grid connection. Most of the data came from his Profiteia database, updated as of that day.
His conclusion fits on one line: the value of storage is still growing, but it has shifted from easy price spikes to skill, contracts, and grid access. Below, we summarize the main insights from each block.
Key takeaways
- Day-ahead spreads widened by 44 to 83% since 2024 in the Netherlands, Belgium, Germany, and France.
- The number of Dutch imbalance quarter-hours above €500 fell by 85% since 2024, since TenneT joined PICASSO and the battery fleet grew.
- A 100 MWh battery on the nameplate delivers about 69 MWh in year five, after accounting for depth of discharge, efficiency, availability, and degradation.
- In the Netherlands, 47 times more congestion volume runs through bilateral grid contracts than through the open GOPACS market.
- The same 50 MW Dutch battery earned between €98,000 and €182,000 per MW from January to August 2026, depending on its contract.
Market: wider spreads, fewer spikes
The starting point is that your price is European, but your grid connection is local. More than 25 countries clear their day-ahead prices in one coupled auction, in quarter-hours since 1 October 2025. Yet on the day of the masterclass, that single auction still produced an average day-ahead price of €142/MWh in the Netherlands and €108/MWh in France.
Gas still sets the level. The Dutch title transfer facility (TTF) gas price rose from €31 to €75/MWh between February and September 2026, while the Dutch day-ahead average climbed from €93 to €152/MWh. Since 2025, the correlation between the two has been 0.71 to 0.81. Gas-fired plants also run fewer hours, so they spread their start-up costs over a smaller base and ask more in the evening peak.
Meanwhile, solar continues to deepen the midday dip. Installed solar capacity in the Netherlands grew from 15 to 29 GW between 2021 and 2026, and in Germany from 54 to 104 GW. The result is wider daily spreads. TB2, the gap between the two most expensive and the two cheapest hours of the day, grew by 44 to 83% since 2024.
| January to September 2026 | Netherlands | Belgium | Germany | France |
|---|---|---|---|---|
| Day-ahead TB2 spread (€/MWh) | 150 | 140 | 152 | 126 |
| Hours with a negative day-ahead price | 393 | 304 | 463 | 534 |
| aFRR up capacity price (€/MW/h) | 21.0 | 13.3 | 10.2 | 31.3 |
| FCR capacity price (€/MW/h) | 24.9 | 22.5 | 18.5 | 19.5 |
Source: Profiteia database, analysis by Stratergy. aFRR is automatic frequency restoration reserve; FCR is frequency containment reserve.
The easy money, however, is disappearing. The number of Dutch quarter-hours with an imbalance price above €500 dropped from 744 in the first nine months of 2024 to 153 in the same period of 2026. The 99th percentile Dutch imbalance price fell from €1,705 to €420/MWh. Batteries are flattening the very spikes that made the first ones profitable.
Jan Willem expects balancing markets to saturate first, followed by slower spread growth. He points to California and Bulgaria as previews. In Bulgaria, storage capacity grew from 1.4 to 4.4 GW in a year, and the day-ahead TB2 spread fell by 9% in 2026. Still, he stressed that gas prices remain a key driver: if gas goes up, spreads go up with it.
The room's own preference shifted too. Asked where they would build their first battery, attendees were split between the four countries, with France drawing a lot of hands. 'A few years ago we saw a lot of movement to Belgium,' Jan Willem noted. 'Now you see a lot for France.'
The asset: from nameplate to delivered MWh
The most sobering slide of the afternoon followed 100 MWh of nameplate capacity down to what you can actually sell in year five:
- 90 MWh after a 90% depth of discharge
- 79 MWh after an 88% round-trip efficiency
- 77 MWh after 97% availability
- 69 MWh after degradation to a state of health of about 90%
Each step is a key performance indicator you can measure and put in a contract. Ignore them, and the business case is off before the first cycle. According to Jan Willem, many large batteries now facing lower revenues got there by stacking these parameters on top of each other, and by overestimating.
Degradation deserves its own line in every model. His example: a 1.7 MW / 3.4 MWh battery running 1.3 cycles a day, at 2.7% degradation per year, drops from 3.06 MWh of usable energy in year one to 2.54 MWh in year eight and 2.08 MWh in year thirteen. Metered field data from Modo Energy points to the same trend, with batteries in Great Britain losing around 4% of capacity per 365 cycles and batteries in Texas around 7%.
Warranties have moved with the market. Systems installed between 2010 and 2018 were typically guaranteed to 80% of capacity at end of life, more recent systems to 70%, and most batteries sold today to 60%. That gives owners more certainty over a longer life, but also less battery to trade in later years. Check the small print, too: a yearly cycle cap in the warranty quietly limits your trading strategy.
Efficiency depends on how the battery is used. Conversion losses are relatively highest when the inverter runs at low load, as it does in the FCR market. A 1 MW inverter pulls 1 MW from the grid but never puts a full 1 MW on the grid: closer to 950 or 960 kW due to conversion losses. According to Jan Willem, that discharge figure is the first thing a trading party asks for. If you sell 1 MW and deliver 960 kW, the difference is settled at the imbalance price, which reached €4,400/MWh at its yearly high.
The biggest technical debate of the day was about duration: 2 hours or 4 hours? We cover that discussion in a separate article (link to follow).
Revenue: same battery, different contract
One battery can serve the wholesale market, the balancing market, and the grid operator, as long as it never sells the same MW twice in the same quarter-hour. In the Netherlands, that means the stack is largely decided the day before delivery: the FCR auction closes at 08:00, the aFRR and mFRR (manual frequency restoration reserve) capacity auctions at 09:00, and the day-ahead auction at 12:00 for whatever MW are left.
The value of each stream varies widely by country. Sold in every hour of the first nine months of 2026, 1 MW of FCR capacity would have earned about €163,000 in the Netherlands. 1 MW of aFRR up capacity would have earned €205,000 in France, but only €67,000 in Germany, as capacity is still bought per transmission system operator (TSO). These markets are also shallow: the Netherlands contracts about 324 MW of aFRR, so a few hundred MW of batteries is enough to move the price.
Intraday trading looks attractive on paper. On average, the intraday TB2 spread was only 3 to 16% above day-ahead in 2026. The extremes were 2.4 to 4 times wider, but those are single trades with limited volume.
That makes the plain day-ahead spread a useful yardstick for anyone hiring an optimizer. 'My simple benchmark is always the TB spreads,' Jan Willem said. If an aggregator can't earn at least the spread a battery would make on day-ahead alone, 'you should say goodbye.' Intraday trading, imbalance, or balancing on top should add 25 to 40%.
The contract matters as much as the trading. Stratergy compared four contract types for the same 50 MW / 200 MWh battery in the Netherlands, from January to August 2026:
| Contract type | Revenue per MW, January to August 2026 |
|---|---|
| Profit share of 85% (upper bound, excluding fees) | €182,000 |
| Intraday benchmark (two cycles a day) | €129,000 |
| Formula contract (floor plus bands) | €127,000 |
| Multi-strategy index with tiered payout | €98,000 |
Source: Profiteia database, analysis by Stratergy.
In an illustrative business case for a 1 MW / 4 MWh battery, with €1.0 mln of capex per MW, the project internal rate of return (IRR) ranged from 4.0% for a merchant, day-ahead-only battery in France to 21.1% for the Dutch profit-share upper bound. A fixed toll of €164,000 per MW per year would be needed for an 8% IRR. Tolling and leasing give banks the certainty they like, but leave little or no upside for the owner. Hybrids, such as a floor plus profit share, sit in between.
Grid and permits: the connection is the project
Each of the four countries has its own bottleneck. In the Netherlands, flexibility is mostly contracted up front: since September 2025, 47 times more volume ran through capacity steering contracts (CSC) than through the GOPACS redispatch market. Grid operators called off 115 GWh under these contracts in twelve months, 85% of it by TenneT. In Flanders, high-voltage connection requests rose sixfold in five years, and 16 of 235 substations are full. France has more than 30 GW of connection capacity reserved by over 170 industrial projects, with 2 to 7 years from request to connection. Germany spent €3.1 bln on congestion management in 2025.
For batteries, Jan Willem sees congestion as more of an opportunity than a threat. 'Congestion actually is a chance for battery systems to make more money in the Netherlands,' he said, calling it one of the fastest-growing revenue streams: 'the cherry on the cake.' There is a catch. Very local congestion only pays if someone nearby can offer flexibility. He mentioned the Limmel grid area where the operator, Enexis, asked for help 4079 times this year, with no deals.
Grid costs deserve the same attention. Dutch transmission tariffs for large users rose up to four times between 2021 and 2024, and both TenneT and the distribution grid operators are moving toward time-dependent tariffs. With the end of net metering for Dutch households on 1 January 2027, charging at the right time also saves on the grid bill.
On the ground, a permit typically takes 12 to 24 months, excluding the grid queue. In congested areas, the full process takes years. Fire safety rules are rarely the problem; their local interpretation is. Bring the fire brigade and the insurer in early, with the UL 9540A test report. High-voltage transformers and switchgear have lead times of 24 months or more, so the transformer and the grid bay set the planning, not the battery containers.
The final lesson: negotiate the permit, grid connection, engineering, procurement, and construction (EPC) contract, warranties, route-to-market, and financing together. In one anonymized case, the warranty allowed 1.5 cycles a day on average, and the toll was set at exactly 1.5. One busy year was enough to void the degradation guarantee.
Closing words
The numbers from the masterclass point in one direction. Spreads are wider than ever, but the spikes are fading, balancing markets are shallow, and every MWh on the nameplate shrinks before it reaches the grid. Value now comes from a realistic model, a well-chosen contract, a capable optimizer, and a grid connection on workable terms. As Jan Willem put it on his final slide, valuing storage is harder work than five years ago, and more rewarding for those who do it well.

Jan Willem Zwang
Energy Trendwatcher

