Who added the most operating capacity — and what it signals for the market
North American utility-scale solar ownership is consolidating faster than ever. The Top-50 owners now control a record share of operating PV, and growth is increasingly concentrated in a smaller set of multi-GW platforms.
Behind the headline totals, the most telling story is who grew fastest over the last year — and why. Based on the Top-50 comparison between 2024 and 2025, these are the biggest movers and shakers in operating portfolio growth.
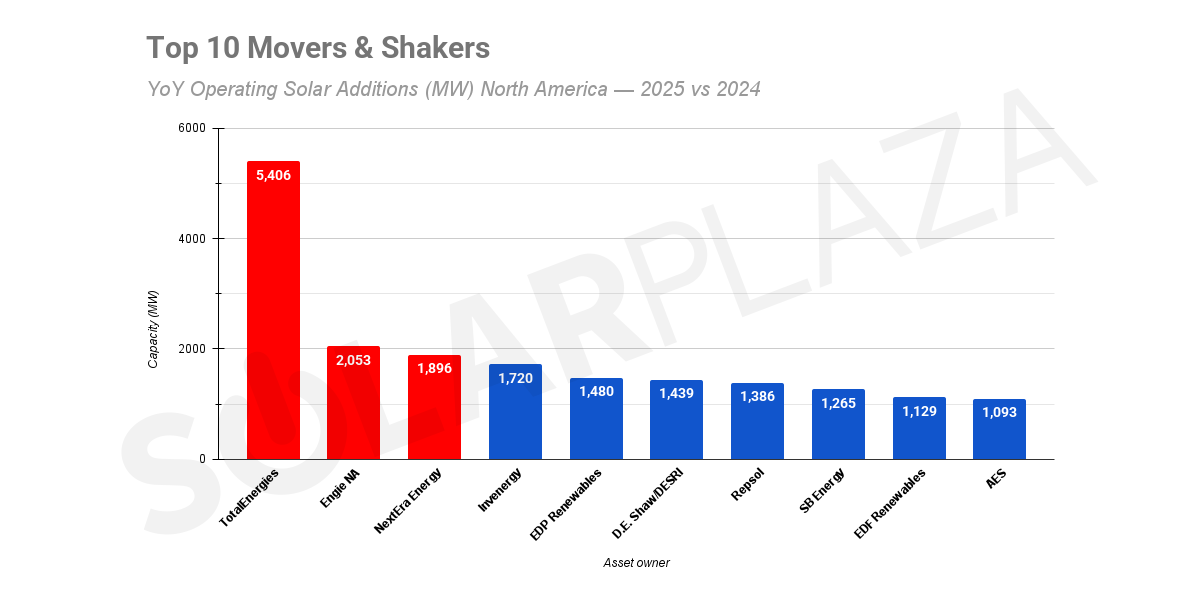
1) TotalEnergies — +5,406 MW YoY (new entry)
TotalEnergies storms into the Top-50 as a dominant platform from day one.
Why it matters: This is a clear signal that global majors are accelerating operating scale in North America — not just developing pipelines.
Market signal: Expect more European and global energy firms to expand through operating-asset rollups and platform acquisitions, not only greenfield.
2) Engie North America — +2,053 MW YoY (new entry)
Engie joins the Top-50 with immediate multi-GW scale.
Why it matters: Another confirmation that the market is maturing into a platform game — scale owners win because they can optimize financing, land, interconnection, and O&M across portfolios.
Market signal: More consolidation around diversified IPPs and corporate portfolios.
3) NextEra Energy — +1,896 MW YoY
NextEra grows from 9,654 MW → 11,550 MW.
Why it matters: The scale leader keeps compounding advantages via a repeatable pipeline + strong in-house execution.
Market signal: The “rich get richer” dynamic continues; mega-platforms remain the pace-setters in hybridization and storage pairing.
4) Invenergy — +1,720 MW YoY
Invenergy jumps from 2,474 MW → 4,194 MW.
Why it matters: This is one of the strongest single-year expansions among established players — showing the power of the “super-IPP” model.
Market signal: Well-capitalized IPPs are racing up the ladder, widening the gap to mid-tier owners.
5) EDP Renewables — +1,480 MW YoY
EDPR rises from 914 MW → 2,394 MW.
Why it matters: This is a massive leap in one year and reinforces that international capital is not slowing down in the U.S. market.
Market signal: Expect continued operating-scale growth from global renewables groups, especially where pipelines can be pulled forward.

6) D. E. Shaw Renewables / DESRI — +1,439 MW YoY
DESRI expands from 2,442 MW → 3,881 MW.
Why it matters: Institutional investors are no longer passive asset owners; they’re platform builders growing operating fleets aggressively.
Market signal: More investor-led rollups and operating-asset M&A, with investment houses behaving like IPPs.
7) Repsol — +1,386 MW YoY (new entry)
Repsol debuts in the Top-50 with sizeable operating capacity.
Why it matters: Yet another large European energy group scaling fast in North America.
Market signal: Cross-border ownership share will keep increasing — and competition for operating assets intensifies.
8) SB Energy — +1,265 MW YoY
SB Energy climbs from 1,642 MW → 2,907 MW.
Why it matters: Strong year-on-year scaling reflects a continued push from sponsor-backed platforms that combine development + acquisitions.
Market signal: The 1–3 GW “growth club” is exploding, tightening the competitive field for smaller owners.
9) EDF Renewables North America — +1,129 MW YoY
EDF grows from 2,944 MW → 4,073 MW.
Why it matters: EDF is a core driver of the rising European share in operating U.S. solar.
Market signal: European majors are moving from pipeline presence to operating dominance.
10) AES — +1,093 MW YoY
AES increases from 4,091 MW → 5,184 MW.
Why it matters: AES’s expansion reinforces the role of integrated IPPs scaling portfolios while also investing into flexibility and storage.
Market signal: Large diversified power companies keep widening their lead through steady operating growth.
What these movers tell us about 2025
Across the Top-50, the fastest growers share three big patterns:
- Consolidation is accelerating.
Three of the top seven movers are new multi-GW entrants, showing how quickly ownership is concentrating in fewer hands. - Global capital is scaling operating assets.
European majors and global energy companies are no longer dipping toes in the market — they’re buying or building platforms at scale. - Platform strategies and repeatable pipelines win.
The biggest YoY gains aren’t coming from one-off projects — they’re coming from repeatable development engines and portfolio M&A.
Download the full Top-50 ranking + dataset
This “Movers & Shakers” list only highlights the growth leaders. The full report includes the entire Top-50 operating table, segmentation by owner type and HQ, state-level breakdowns, and deeper market context.
*About this article: This article was composed with the help of AI, but was based on our 100% human-researched and human-written Top 50 of North American solar asset owners report.