
Globally, the prices of energy produced from solar PV have been significantly greater than that off their non-renewable counterparts in the past. This meant that solar energy could only compete with fossil fuels if it was subsidized or supported by other financial incentives. In the United States, which is considered a much more developed market in terms of the adoption of solar PV than other non-European markets, PPA prices averaged around a $130/MW in 2010. Yet in recent years solar PV projects have not only shown that they can be price competitive with their non-solar counterparts but in some cases have proven to be significantly cheaper.
The lowest ever PPA price can be found in Abu Dhabi, United Arab Emirates at only $29.9/MWh.
Reportedly, PPA auctions have been receiving lower and lower price bids from developers all around the world. In India, the average price of bids have dropped more than 60% in the last five years; Mexico witnessed bid prices that averaged only $50/MWh; In Chile, a recent auction averaged bids of less than $48/MWh resulting in a 40% price decline from the previously held auction.
Currently, the lowest ever PPA price can be found in Abu Dhabi, United Arab Emirates at only $29.9/MWh, however it is definitely not certain that things will remain like this for long. The drop in PPA prices seems to be intensifying as in the the year of 2016 only, the record for the world’s lowest solar energy price has been broken several times.
By 2050 solar energy prices will be as low as $20-40/MWh.
Figure 1 shows that global PPA prices have been declining throughout the years. On average, solar energy prices in the United States have tended to be at $50/MWh in 2015, however, some more aggressive pricing strategies have produced energy prices as low as $30/MWh. Europe is keeping up with the American solar PPA price trends with a small lag. According to the Fraunhofer institute of Solar Energy Systems, solar PV energy has reached a level where it is one of the most effective sources of energy. Projections show that by 2025 prices will have declined to $40-60/MWh in Central and Southern Europe, and by 2050 solar energy prices will be as low as $20-40/MWh. Other parts of the world vary in average solar PPA prices by region, however, it is important to note that these regions contain more than ⅔ of our top 30 PPA prices.
30 lowest PPAs signed globally
Rank
$/kWh for calculations
Project name
Project size [MW]
Country
Date start operation
Company
1 0.024 ADWEA 350 UAE 2019 ADWEA
2 0.029 - 120 Chile 2019 Solarpack Corp. Tecnologica
3 0.030 800 MW Sheikh Maktoum Solar Park Phase III 80 UAE 2020 Dubai Electricity and Water Authority (DEWA)
4 0.035 427-megawatt project by Enel 427 Mexico 2018 Enel
5 0.039 - 100 USA 2018 NV Energy
6 0.040 - 0.398 USA 2014 THiNKnrg
7 0.041 Austin Energy Recurrent 150 USA 2016 -
8 0.045 Sandstone 45 USA 2015 -
9 0.049 - 50 UAE - Saudi Electric Company
10 0.050 - 150 USA 2016 Offtaker: Austin Energy
Developer: Reccurent Energy
11 0.051 Macho Springs Solar Project 50 USA 2014 Offtaker: El Paso Electric
Developer: First Solar
12 0.051 River Bend 80 USA 2016 -
13 0.060 Dubai Electricity and Water Authority 100 UAE - ACWA power
14 0.064 Amunche Solar 16 Chile 2017 Amunche Solar (Solarpack)
15 0.064 Indian state of Rajasthan 70 India - Fortum
16 0.065 - 515 USA 2016 Offtaker: Georgia Power
Developer: unknown
17 0.067 - 100 India 2017 FRV
18 0.067 - 1000 India 2016 -
19 0.070 Andhra Pradesh 500 India - SunEdison
20 0.070 80 megawatts in solar PPAs 80 USA 2017 Offtaker: Southern California Edison
Developer: Silverado Power / Ridgeline Energy
21 0.073 Lost Hills PV 32 USA 2019 First Solar and PG&E
22 0.075 Power plant Rajasthan 5 India 2013 -
23 0.076 SkyPower Madhya Pradesh 150 -India - Skypower
24 0.078 - 5 Brazil - Sun premier
25 0.079 - 20 Brazil - Invesiones Solares
26 0.079 - 60 Brazil - Gransolar
27 0.079 - 410 Brazil - Enel Green Power
28 0.083 - - Brazil - Conergy
29 0.086 The Green Energy Corridor 500 India 2019 Offtaker: unknown
Developer: First Solar
30 0.130 - 86.5 India - Essel Group / Rays Power
| Rank | $/kWh for calculations | Project name | Project size [MW] | Country | Date start operation | Company |
|---|---|---|---|---|---|---|
| 1 | 0.024 | ADWEA | 350 | UAE | 2019 | ADWEA |
| 2 | 0.029 | - | 120 | Chile | 2019 | Solarpack Corp. Tecnologica |
| 3 | 0.030 | 800 MW Sheikh Maktoum Solar Park Phase III | 80 | UAE | 2020 | Dubai Electricity and Water Authority (DEWA) |
| 4 | 0.035 | 427-megawatt project by Enel | 427 | Mexico | 2018 | Enel |
| 5 | 0.039 | - | 100 | USA | 2018 | NV Energy |
| 6 | 0.040 | - | 0.398 | USA | 2014 | THiNKnrg |
| 7 | 0.041 | Austin Energy Recurrent | 150 | USA | 2016 | - |
| 8 | 0.045 | Sandstone | 45 | USA | 2015 | - |
| 9 | 0.049 | - | 50 | UAE | - | Saudi Electric Company |
| 10 | 0.050 | - | 150 | USA | 2016 | Offtaker: Austin Energy Developer: Reccurent Energy |
| 11 | 0.051 | Macho Springs Solar Project | 50 | USA | 2014 | Offtaker: El Paso Electric Developer: First Solar |
| 12 | 0.051 | River Bend | 80 | USA | 2016 | - |
| 13 | 0.060 | Dubai Electricity and Water Authority | 100 | UAE | - | ACWA power |
| 14 | 0.064 | Amunche Solar | 16 | Chile | 2017 | Amunche Solar (Solarpack) |
| 15 | 0.064 | Indian state of Rajasthan | 70 | India | - | Fortum |
| 16 | 0.065 | - | 515 | USA | 2016 | Offtaker: Georgia Power Developer: unknown |
| 17 | 0.067 | - | 100 | India | 2017 | FRV |
| 18 | 0.067 | - | 1000 | India | 2016 | - |
| 19 | 0.070 | Andhra Pradesh | 500 | India | - | SunEdison |
| 20 | 0.070 | 80 megawatts in solar PPAs | 80 | USA | 2017 | Offtaker: Southern California Edison Developer: Silverado Power / Ridgeline Energy |
| 21 | 0.073 | Lost Hills PV | 32 | USA | 2019 | First Solar and PG&E |
| 22 | 0.075 | Power plant Rajasthan | 5 | India | 2013 | - |
| 23 | 0.076 | SkyPower Madhya Pradesh | 150 | -India | - | Skypower |
| 24 | 0.078 | - | 5 | Brazil | - | Sun premier |
| 25 | 0.079 | - | 20 | Brazil | - | Invesiones Solares |
| 26 | 0.079 | - | 60 | Brazil | - | Gransolar |
| 27 | 0.079 | - | 410 | Brazil | - | Enel Green Power |
| 28 | 0.083 | - | - | Brazil | - | Conergy |
| 29 | 0.086 | The Green Energy Corridor | 500 | India | 2019 | Offtaker: unknown Developer: First Solar |
| 30 | 0.130 | - | 86.5 | India | - | Essel Group / Rays Power |
Figure 1: 30 lowest PPA prcies worldwide
The most important factors influencing PPA prices
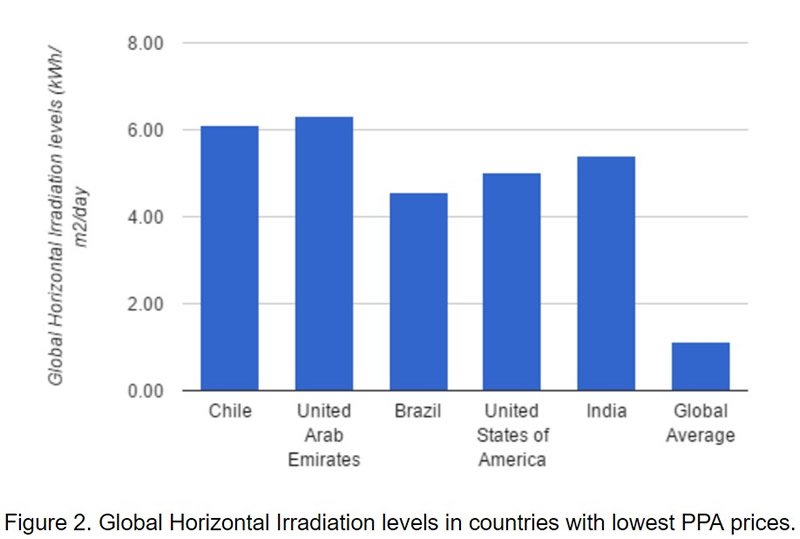
PPA prices greatly vary based on the solar irradiation levels of the project location. All countries and regions that have reported record-breaking PPA energy prices have outstanding solar attributes (Figure 2). The higher the solar irradiance level in a country, the more efficiently a solar power plant can produce electricity which eventually leads to lower energy prices. .
Another, perhaps one of the most important factor that plays a significant role in determining the energy price of solar projects, is the availability of subsidies or governmental incentives. The comparison of PPA prices around the world should be done in a very cautious manner as comparing PPA prices with and without subsidies can provide a very biased picture of the current solar energy price status.
For example, it might seem like the United States is among the countries with the most price competitive solar PPA projects and while this is certainly true to some extent, many American projects are heavily subsidized. The most prominent American subsidy, the ITC, comes in the form of a 30% tax credit which benefited Americans through a sixteen-fold increase in solar installations since the policy’s implementation. However, the United States is not the only one promoting renewable energy sources through subsidies and other financial incentives. Less developed countries may also make use of subsidies including low cost financing or guarantees from development banks and/or sovereign wealth funds, or PPAs denominated in U.S. dollars to mitigate currency risk.
Smaller scale PV projects (20-50 MW range) can be just as price competitive as big ones.
The size of solar PV projects also play a key role in attaining the lowest per kWh energy prices, however it does not directly follow that the bigger the project scale is, the cheaper energy it can produce. In general, utilities of scale for solar projects have proven to reduce energy prices, however, research conducted by the U.S. Department of Energy and prepared by Lawrence Berkeley National Laboratory showed that smaller scale PV projects (20-50 MW range) can be just as price competitive as big ones. Looking at our list of top 30 lowest PPA solar projects, a similar picture seems to emerge (Figure 3). Although it does show that the larger projects are in capacity the corresponding PPA prices declines, this relationship is very weak at its best.

If global PPA prices for solar PV plants continue to decline at the rate at which they have been so far, they will soon overtake their competing technologies. Some areas, where the conditions for cheap solar prices are met, PV projects have already shown to be superior to fossil fuel technologies. Countries with high solar radiation levels and sound incentive plans may already experience parity between solar and other energy sources. Interestingly, based on our top 30 list, the capacity of PV projects is not among the most important conditions for cheap PPA despite what one might think about the benefits of economies of scale.