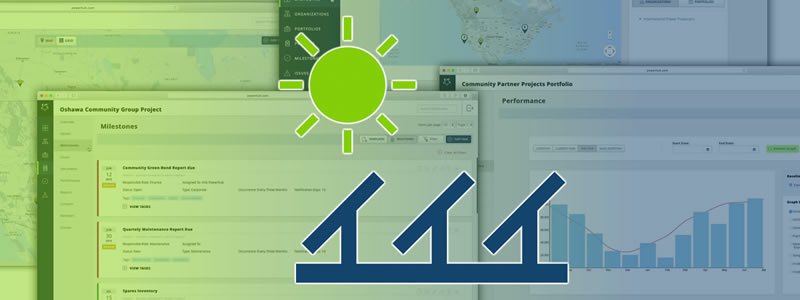
Aggregating portfolio-wide operational and financial data could help improve asset management staff efficiency by between 10% and 20%, according Etienne Lecompte of PowerHub. In some cases, said the chief executive of the Canadian based asset management software company, “people have said they can double the number of projects they can supervise” by automating routine tasks.
Greater efficiency is needed as the US solar industry gets increasingly competitive and asset owners and developers find themselves having to bid for utility or corporate power-purchase agreements instead of getting fixed tariffs, he said.
“As this [situation] is becoming more and more competitive, bringing your price - and thus your costs - down is super important,” he noted. In addition, as solar component prices bottom out, it is becoming more important to focus on optimising overall Asset Management and O&M costs over the lifetime of a plant.
“By managing big portfolios proactively, rather than reactively, through monitoring early warning signs and automating time consuming tasks and more, you’re empowering asset managers to do more,” Lecompte stated. “That can have a great impact on your operational expenditure.”
Solar plants “are not just outputs,” he said. “They are complex projects which need to be managed from cradle to grave in a more holistic fashion. It’s very hard to do that, but when you do it right you become empowered to focus on what matters.” As an example of that holistic view, Lecompte said portfolio asset managers should look at their best and worst performing plants to see if they have things in common, such as the same O&M provider, equipment, EPC contractors, or geography, which could be affecting performance.
“That’s where aggregation tools allow you to see what’s moving the needle,” he said.
Another advantage of such tools is that they make it easier to track and monitor events that can have a material impact on the asset holder’s business. As an example, Lecompte cites a plant that was being sold to a third party who queried why production had dropped in one of the months previous to the sale. The reason was that there had been some unscheduled maintenance on a transmission line done by the local utility at that time, which was easy to see because the asset manager was using an aggregation tool that allowed them to drill down into the data.
However, another asset manager handling hundreds of contracts, events and projects manually, it would have been harder to determine the cause of the lost production, which potentially could have affected the final selling price.
Another example of how having access to aggregated data can allow you to reduce the number of truck rolls by, for instance, combining reactive maintenance visits with proactive O&M tasks that are due to be carried out soon anyway.
“Tools like PowerHub allow you to automate a lot of that work,” Lecompte said. “You shouldn’t be copying your project data to lines in Excel each month, or manually paying an invoice.” Tasks like these -and many more- are now all automated inside the PowerHub software, that can take care of acquiring data, comparing performances between sites, generating reports and invoices, calculating DSCR and CAFDI, etc. without the manual intervention of a human operator.
“The age of Excel is over.”
